












ToldUntold Logo

Platform · Business intelligence

What knowledge earns.

ToldUntold transforms brand and product knowledge into measurable impact.

By connecting content engagement with business performance, you see not just what your teams know, but what that knowledge earns.

Business Intelligence

Prove the return on training.

Cross-lag correlation analysis links training activity to sales outcomes. You see not just who completed the training, but how completion moved the numbers in the following weeks, store by store, product by product.

The content impact index reveals which specific programmes drive the most commercial results. Justify budget allocation with data, not intuition. Training is no longer a cost centre. It is a revenue driver you can measure.

  1. 1Cross-lag correlation: when and how much training moves sales, from three months before to six months after.
  2. 2Content impact index: which programmes drive commercial results, not just engagement.
  3. 3Sales uplift attribution: trained versus untrained stores, seasonality neutralised.
The study behind the method

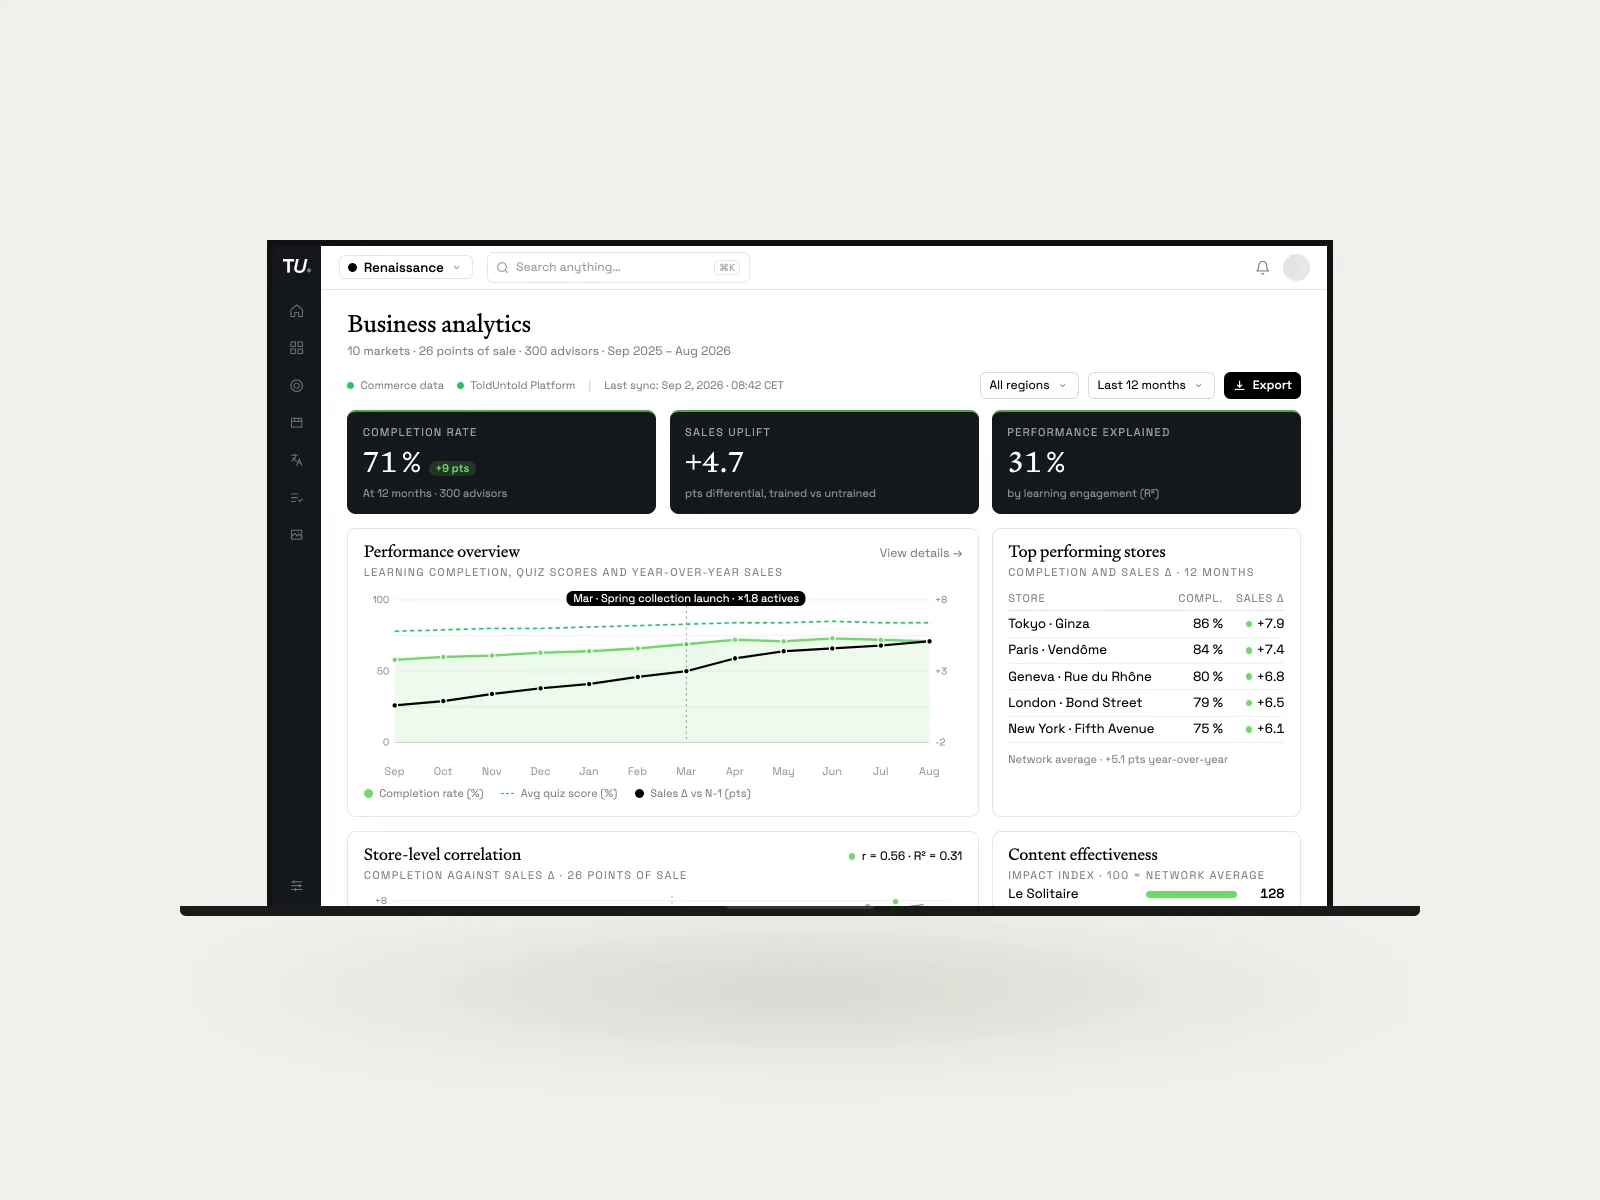
Business analytics

10 markets · 26 points of sale · 300 advisors · Sep 2025 – Aug 2026

Commerce dataToldUntold Platform|Last sync: Sep 2, 2026 · 08:42 CETAll regions Last 12 months Export
Completion rate
0 %+9 pts
At 12 months · 300 advisors
Sales uplift
+0.0
pts differential, trained vs untrained
Performance explained
0 %
by learning engagement (R²)
Performance overview
Learning completion, quiz scores and year-over-year sales
View details →
050100-2+3+8Mar · Spring collection launch · ×1.8 actives
SepOctNovDecJanFebMarAprMayJunJulAug
Completion rate (%)Avg quiz score (%)Sales Δ vs N-1 (pts)
Top performing stores
Completion and sales Δ · 12 months
StoreCompl.Sales Δ
Tokyo · Ginza86 %+7.9
Paris · Vendôme84 %+7.4
Geneva · Rue du Rhône80 %+6.8
London · Bond Street79 %+6.5
New York · Fifth Avenue75 %+6.1
Network average · +5.1 pts year-over-year
Store-level correlation
Completion against sales Δ · 26 points of sale
r = 0.56 · R² = 0.31
0+4+850 %60 %70 %80 %90 %
Content effectiveness
Impact index · 100 = network average
Le Solitaire128
Lumière122
Rivière119
Boutique114
La Taille111

Incremental business

What to push, and what it could earn.

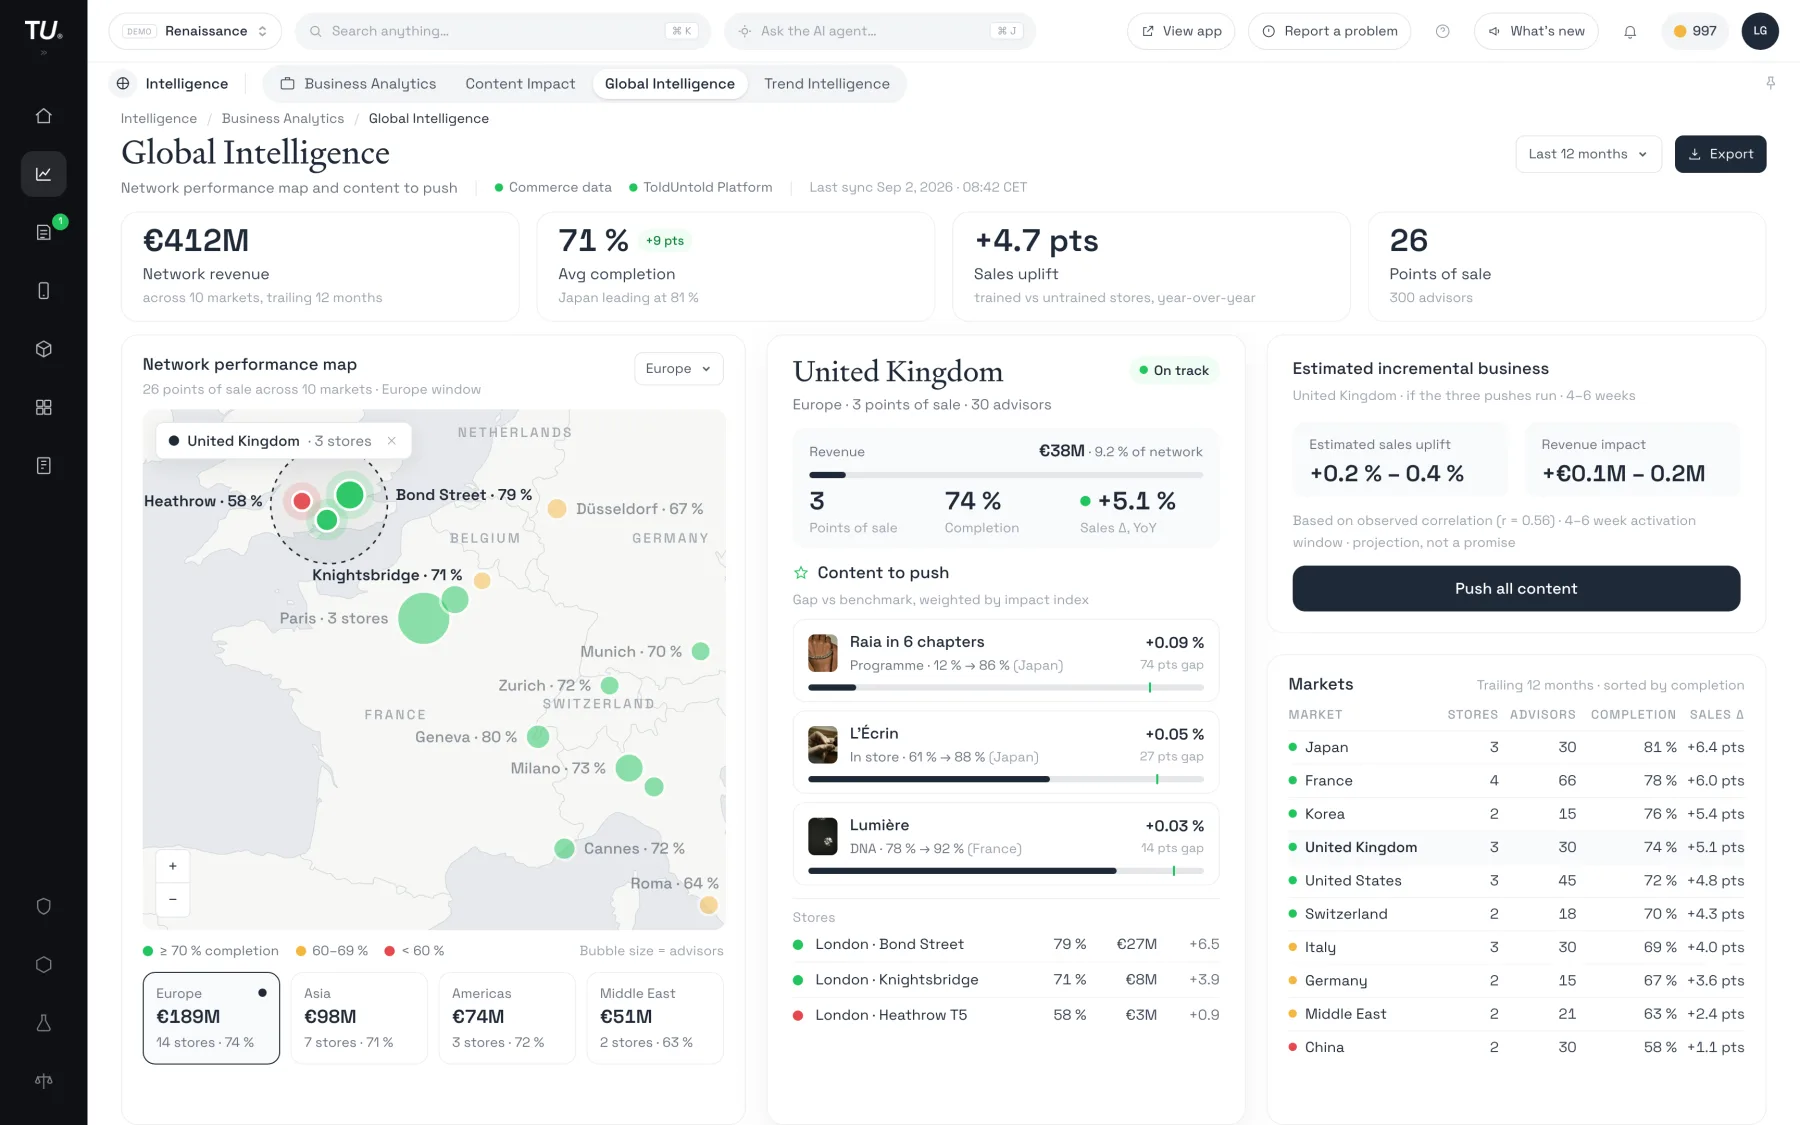
Because content is linked back to the products it covers, the platform can read, store by store, how a product's content performs and how that product sells.

This screen puts that reading on a map. Pick a region and you see the stores inside it, the content worth pushing there, and an estimate of the incremental business a push could generate.

A region opened on the map: its stores, the content suggested for them, and the estimated incremental business of a push.
Demonstration data
  1. 1Regions and their stores
  2. 2Content to push in a region
  3. 3Estimated incremental business

The Knowledge–Performance Link

Trained stores sell more.

We cross-referenced granular learning data with store-level sales performance across three Maisons, over 6 to 12 months, to isolate the variables that separate effective training from expensive noise.

+4.9 pts
sales growth, trained stores versus untrained
KPL study, 2025
Read the study

The method

Each store's learning engagement is matched against its own year-over-year sales change. No aggregation hides underperformers.

Year-over-year comparison eliminates seasonality. Pre-deployment baselines confirm engagement groups were comparable before launch.

Pearson correlation, Granger causality, multivariate regression with R² decomposition. Full methodology in the white paper.

What it does not prove

That training caused the difference. The study measures an association with a dose-response pattern consistent with a causal relationship — not a proof of causation.

The data behind the impact

Measured, not claimed.

91 %
of team members completed their entire learning journey
+4.9 pts
sales growth, trained stores versus untrained
4–6 wks
from training to measurable sales impact

Knowledge–Performance Link study, 2025 · 3 maisons, 1,850 advisors, 275 points of sale.

Read the study

Atlas

Atlas, the map of what your teams know.

One map of knowledge across the maison: every module, every market, every store, down to the individual advisor.

Coverage reads by product line as well as by market, so you see where knowledge runs thin, line by line. From there, a gap on the map becomes an action: a reminder sent to the advisors who are behind, or an objective set for the stores concerned.

  • Coverage by market, store and product line
  • Gaps ranked by commercial weight
  • From the map to a nudge, in one gesture

Atlas

Completion map · Renaissance · 10 markets · 26 points of sale

Markets × Categories52 actives · GridData as of 4 September at 09:41
Search rows…6 rows · 0 groupsExpand all
Heritage 4 contents Stones 9 contents Raia collection 6 contents Care 5 contents Boutique 4 contents Paris · Vendôme36 ppl93 %2 to nudge91 %3 to nudge88 %4 to nudge90 %3 to nudge89 %4 to nudgeLondon28 ppl88 %3 to nudge86 %4 to nudge84 %4 to nudge77 %6 to nudge80 %5 to nudgeMilano52 ppl82 %9 to nudge74 %13 to nudge42 %38 to nudge76 %12 to nudge73 %14 to nudgeGeneva22 ppl91 %2 to nudge89 %2 to nudge90 %2 to nudge84 %3 to nudge87 %3 to nudgeTokyo · Ginza41 ppl93 %3 to nudge90 %4 to nudge95 %2 to nudge89 %4 to nudge94 %2 to nudgeDubai14 ppl87 %2 to nudge83 %2 to nudge86 %2 to nudge80 %3 to nudge82 %2 to nudge
Top 5 opportunities
1Milano × Raia collection38 to nudge · · 42 %Boost
2Milano × Stones13 to nudge · · 74 %Boost
3Milano × Boutique14 to nudge · · 73 %Boost
4London × Care6 to nudge · · 77 %Boost
5Milano × Heritage9 to nudge · · 82 %Boost

Ranked by people to nudge × column importance. Click a cell, a row or a column header to compose your own selection.

ToldUntoldPlatformContent StudioPricingDevelopersSign out
Developers/Analytics
Analytics
ToldUntold Client API v1 — Analytics Integration Guide

Machine-to-machine REST API for pulling a brand's ToldUntold learning analytics — brand-level daily aggregates, content-level metrics, and pseudonymised user-level rows — into a BI, ERP or HRIS system.

1. Overview & audience

Five read-only endpoints under /v1/client/analytics. Bearer auth, scoped keys, flat JSON errors with stable machine codes.

GET/statusKey smoke-test & dataset freshnessno scope
GET/metrics/dailyBrand-level daily aggregatesanalytics.metrics:read
GET/metrics/contentsContent-level metrics (brand-global)analytics.metrics:read
GET/users/dailyPseudonymised per-user daily rowsanalytics.users:read
GET/users/contentsPseudonymised user × content sync rowsanalytics.users:read
2. Authentication
Authorization: Bearer tuk_<key_id>.<secret> Copy
analytics.metrics:readmetrics/daily · metrics/contents — the aggregate datasetsanalytics.users:readusers/daily · users/contents — pseudonymised, never implied

Developers

Your data, open.

The ToldUntold Client API is a server-to-server REST API for your PIM, ERP, OMS, BI warehouse or HRIS. Scoped keys, flat JSON errors, predictable pagination, idempotent writes. You won't need an OAuth flow or an SDK.

Pull learning analytics into your BI warehouse or HRIS: daily brand aggregates, per-content metrics and pseudonymised per-user rows, complete up to the previous day every morning.

  • Catalog — 27 endpoints, read & write
  • Analytics — 5 endpoints, read-only
  • OpenAPI 3.1 contracts, Postman collections
The developer portal
Training. Intelligence. Content Production. Visual Merchandising. AI. One platform built for retail performance.